Most data teams are familiar with the same questions that often appear in the morning:
- “Why does the report not show any data today?”
- “Is there a delay?”
- “Why are the numbers different from yesterday?”
- “I saw duplicated records.”
- “There are blank values.”
- “The report is missing two days of data.”
These questions may sound simple, but they often point to a bigger issue: data quality.
Data quality issues are not new. They happen across many organisations and industries. They can appear as delayed data, duplicated records, missing values, inconsistent numbers between reports, incorrect calculations, or data that simply does not make sense.
For business users, these issues create frustration. For data teams, they often become daily investigation tasks. But the real risk is bigger than fixing one report. Poor data quality can reduce trust, slow down decision-making, increase operational risk, and impact business outcomes.
Why Data Quality Matters
Data quality is important in every industry, although the impact may differ depending on the business context.
In healthcare, poor data quality can affect patient records, clinical information, privacy, and quality of care. In finance, it is critical for reporting, risk assessment, regulatory compliance, and financial modelling. In manufacturing, poor data quality can affect production planning, inventory management, quality control, and supply chain decisions.
The importance of data quality has become even greater with the growth of AI and machine learning. Many organisations now use AI to support forecasting, recommendation engines, customer insights, business operations, and decision-making.
If the data going into these models is poor, the output can also be poor.
The old saying still applies: garbage in, garbage out.
Why Poor Data Quality Happens
Poor data quality can happen for many reasons.
Sometimes it is caused by human error. For example, someone may accidentally enter the wrong quantity into a system. Instead of entering 10, they may enter 1,000. A simple mistake can create a significant downstream issue.
Another common cause is the lack of standardisation. If teams use different formats, definitions, or business rules, the data can become inconsistent. Dates may be stored in different formats, customer names may be entered differently, and business terms may mean different things across departments.
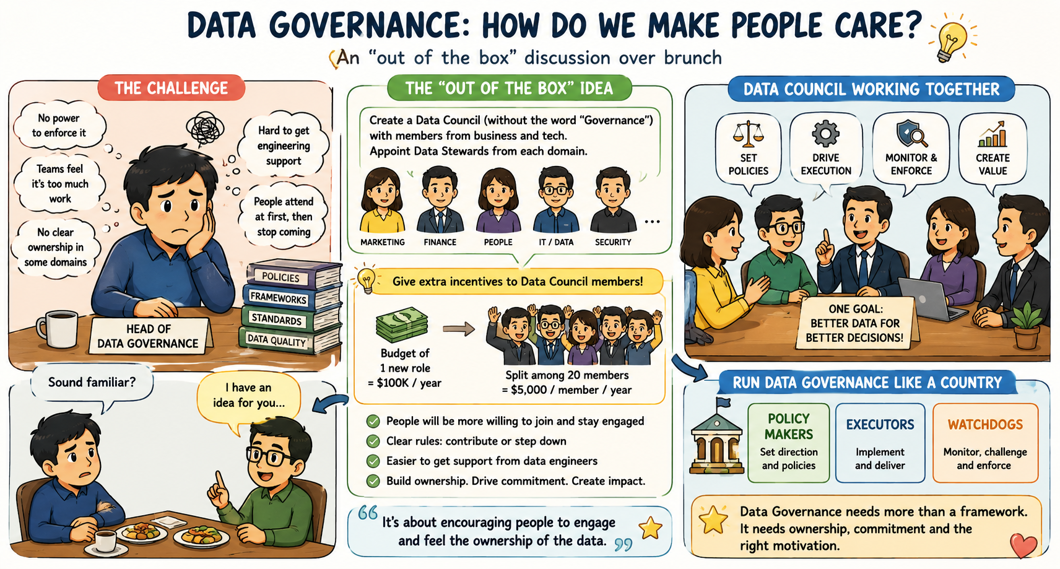
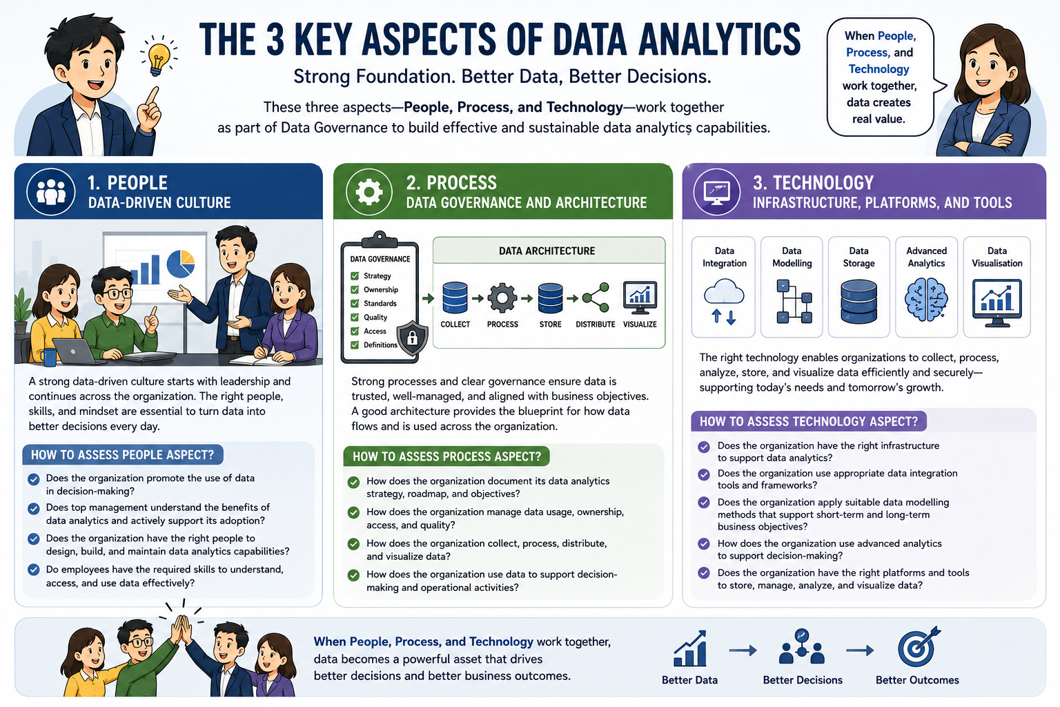
Poor data quality can also happen because of inconsistent development processes, incomplete documentation, unclear ownership, and lack of governance. When no one clearly owns the data, no one feels fully responsible for validating it.
Another common assumption is that once data has landed in the data warehouse, it is automatically clean. In reality, data does not magically become trusted just because it has moved from one system to another. It still needs to be checked, validated, monitored, and improved.
A Structured Approach to Data Quality
To improve data quality, organisations need a structured approach.
- This starts with clear data quality standards, such as naming conventions, date formats, time zones, decimal points, mandatory fields, acceptable values, and common business definitions.
- Organisations also need data quality metrics. Without metrics, it is difficult to know whether data quality is improving or getting worse.
- Clear data ownership is also essential. Data quality should not belong only to the data team. Business teams need to be involved because they understand the meaning, context, and usage of the data.
- Organisations also need data quality rules. These rules define how data should be validated, monitored, measured, and corrected.
Finally, organisations need standardised data collection and processing methods. The more consistent the process, the easier it is to maintain quality.
The Data Quality Lifecycle
A practical data quality lifecycle can be described in five steps: Plan, Identify, Do, Check, and Act.
- Plan is where the organisation defines the data quality strategy, criteria, priorities, and expectations.
- Identify is where the organisation selects the most important data quality issues to solve. It is usually better to start small, focus on critical data areas, and expand over time.
- Do is where the data quality operation is developed. This includes collecting data, applying validation logic, running checks, and storing the results.
- Check is where the results are reviewed and monitored. This helps the organisation understand the current health of its data.
- Act is where data quality issues are addressed. This may involve fixing duplicated records, correcting invalid values, filling missing data, or improving the process that caused the issue.
This lifecycle should not be treated as a one-time activity. Data quality is continuous. Once one issue is resolved, another may appear. It is similar to a game of whack-a-mole: you fix one problem, and another one pops up.
Key Data Quality Metrics
To measure data quality properly, organisations can use several key metrics.
- Accuracy measures whether data correctly represents the real-world value or expected result.
- Completeness checks whether required data is available, such as whether sales data for the last seven days has been fully loaded.
- Consistency checks whether data is aligned across systems, layers, and reports. For example, record counts or totals should match between source systems, staging, data warehouse, and data marts.
- Integrity validates the relationships between datasets. For example, a product or customer used in a transaction should exist in the related master data.
- Timeliness measures whether data is available when expected. If daily sales data is expected by 6 AM, the process should compare the expected arrival time with the actual load time.
- Validity checks whether data follows defined rules, such as email format, phone number format, date format, postcode rules, or mandatory fields.
- Uniqueness checks whether records are duplicated. This is important for customer data, product data, transaction data, and other key business entities.
- Reasonability checks whether the data makes sense. For example, it can help detect unusually high quantities, abnormal values, or suspicious patterns.
Together, these metrics help organisations understand the overall health of their data.
Data Quality Architecture
A structured data quality approach also requires the right architecture.
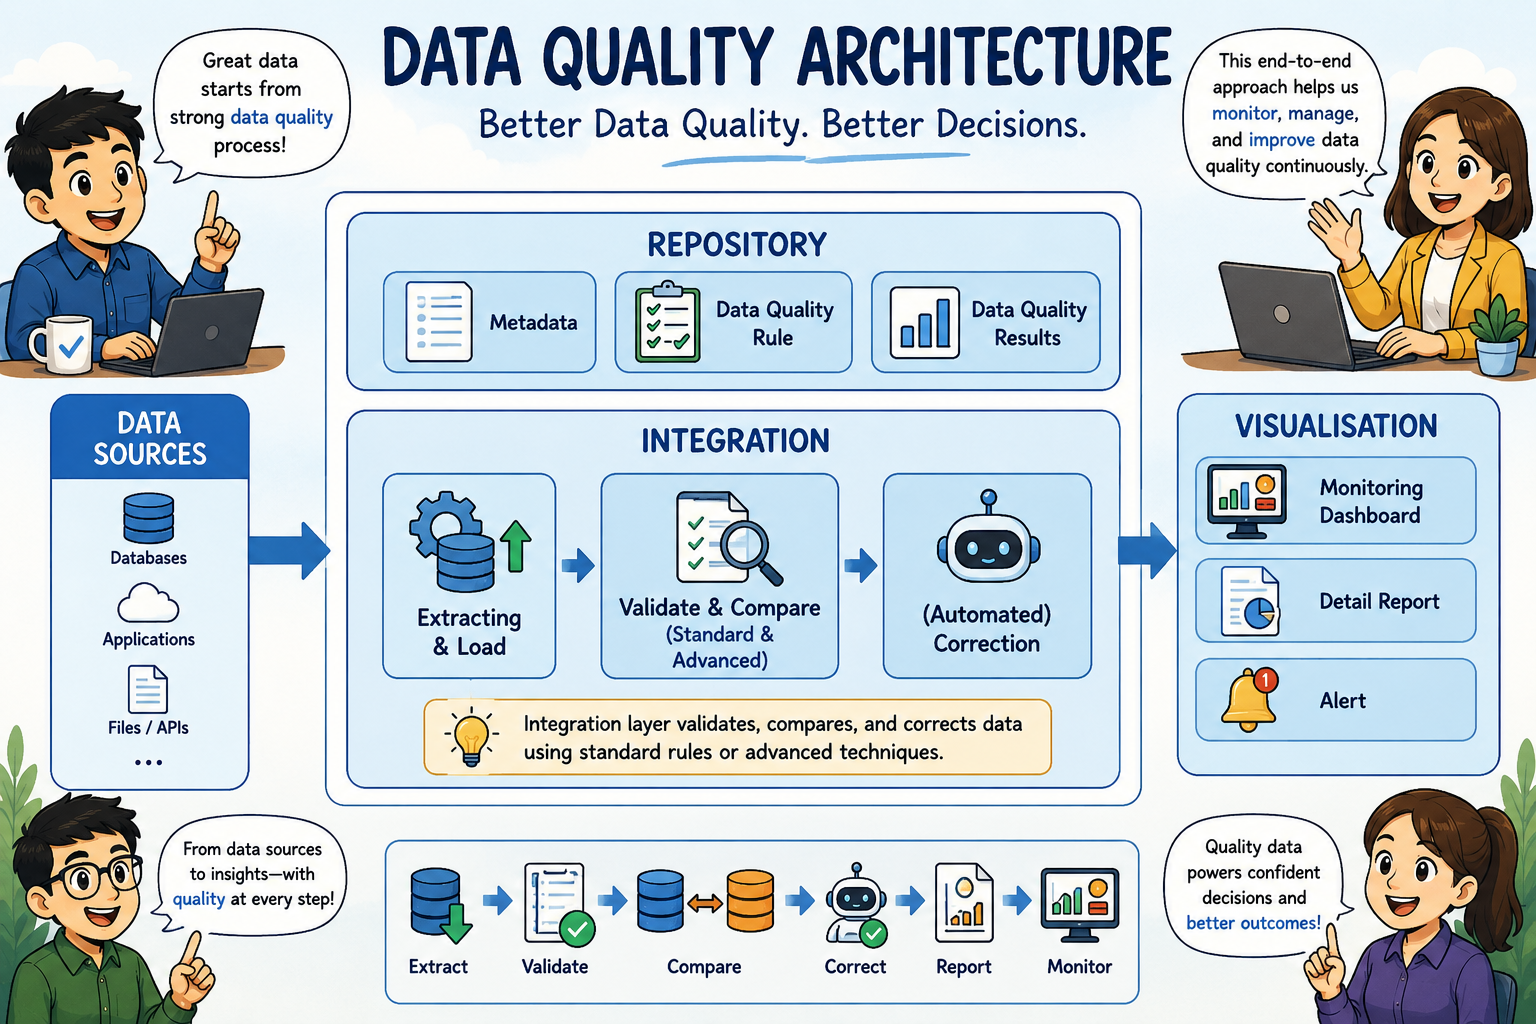
At a high level, data quality architecture usually includes three main areas: repository, integration, and reporting.
- The data quality repository stores data source configurations, metadata, validation rules, business rules, scripts, and data quality results. This becomes especially important when organisations need to monitor hundreds or thousands of tables.
- The integration process extracts and loads the data, validates it, compares it, and stores the results. In many ways, data quality is another type of ETL or ELT process. It collects data, applies logic, checks results, and records outcomes.
- Organisations can also use external tools, machine learning, or AI to support advanced checks. For example, AI can help detect anomalies, identify suspicious values, flag potential errors, fill missing values based on patterns, compare similar records, or validate media data such as images and documents.
- The final area is reporting and alerting. Data quality results should be visible through monitoring dashboards, detailed reports, and alerts. These outputs help teams identify issues quickly and take action.
However, alerts should be designed carefully. If alerts are sent too frequently, people may start to ignore them. For most data sources, it may be better to send notifications once or twice a day, unless the data is highly critical.
Data Quality Remediation
Once data quality issues are identified, the next step is remediation.
There are three common approaches: automated correction, manual correction, and hybrid correction.
- Automated correction is useful when the rule is clear and low risk. Examples include removing extra spaces, converting date formats, fixing phone number patterns, reloading missing data, applying default values, or correcting simple known errors.
- Manual correction requires human review. This is useful when the issue needs business judgment or when the correction cannot be safely automated.
- Hybrid correction combines automation with human oversight. For example, AI may detect similar customer records and suggest a possible match, but a person reviews and confirms the final decision.
This approach helps organisations improve efficiency while still maintaining control and accountability.
The Benefits of Structured Data Quality
A structured data quality process helps organisations build trust in their data, reduce risk, improve decision-making, increase efficiency, and strengthen compliance.
Data quality is not just a technical activity. It is a business capability that requires clear standards, ownership, monitoring, and continuous improvement.
Data may be the new gold, but it only becomes valuable when it is properly refined.